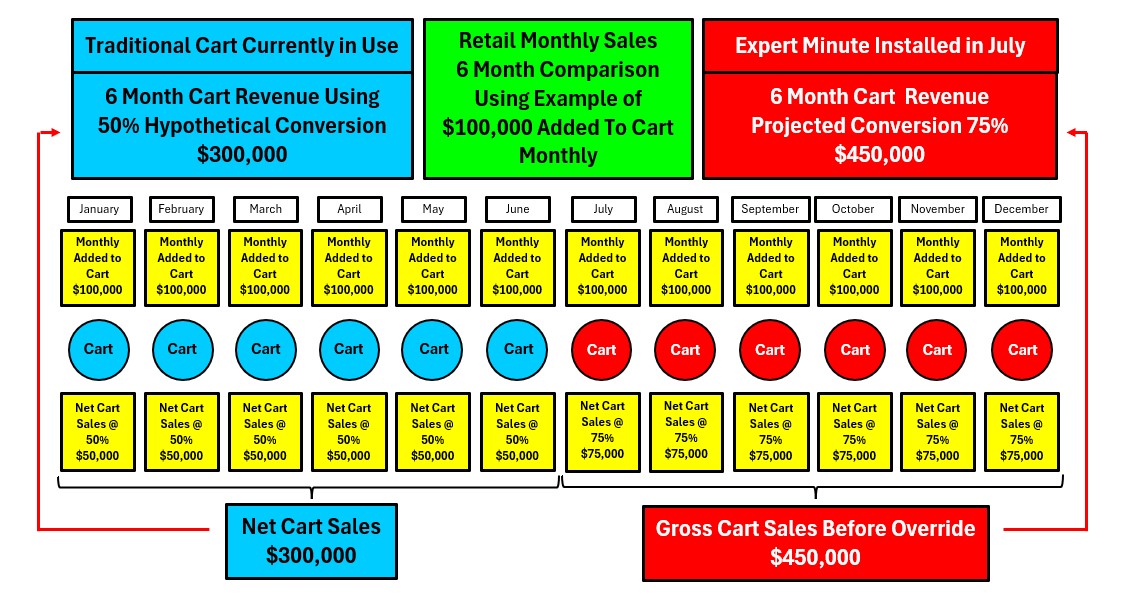
This flowchart is designed to illustrate the astounding losses from shopping cart abandonment experienced by many online retail stores. We offer a better solution with Expert Minute which reduces cart abandonment by 50% or more!
This flowchart shows a hypothetical comparison between a Traditional Cart and the Expert Minute technology for 6 month time frames. The flow chart assumes Monthly Added to Cart amounts to be $100,000. The blue areas of the flowchart assume a 50% conversion rate from amounts added to the carts. The retail shopping industry average conversion rate is 5% to 10% of amounts added to carts, so we are being very conservative in our calculations. The red areas of the flowchart illustrate a 75% cart conversion rate for a retail store by utilizing our technology and know-how within an existing cart system. So, the conversion rate is assumed to increase from 50% to 75%, which is a 50% increase from the current assumed conversion ratio.
Our system requires the retail store to already have an online chat or video system in place. Our Expert Minute technology utilizes the existing chat or video system being used by retail stores and is compatible with most online shopping cart systems used by retailers nationwide.
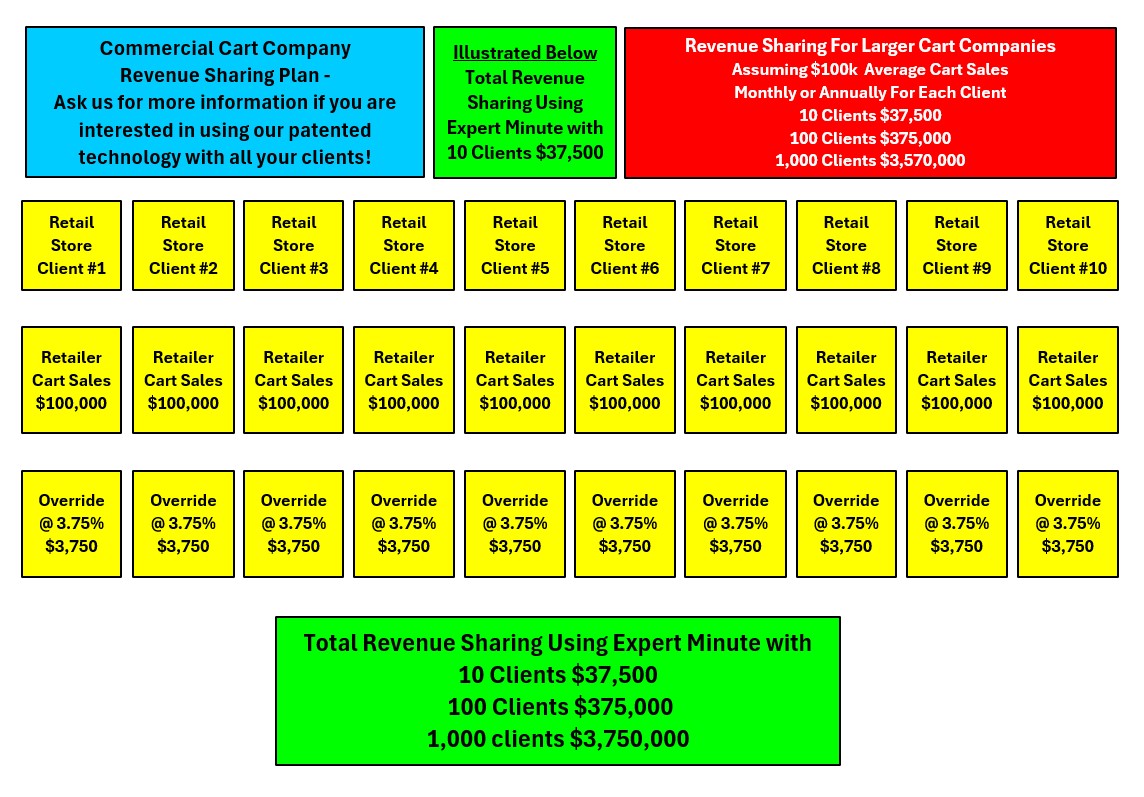
This flow chart illustrates our Revenue Sharing Plan with large commercial cart companies which offer online shopping carts to online retail stores. In our hypothetical illustration, we are illustrating Revenue Sharing For Commercial Cart Companies Assuming $100,000 Average Cart Sales Monthly or Annually For Each of 10 Clients. Of course, retail stores with smaller Added to Cart amounts will produce a corresponding smaller revenue share for the commercial cart company.
Our system requires the retail stores to already have an online chat or video system in place. Our Expert Minute technology utilizes the existing chat or video system being used by retail stores and is compatible with most online shopping cart systems used by retailers nationwide